
Dashboards
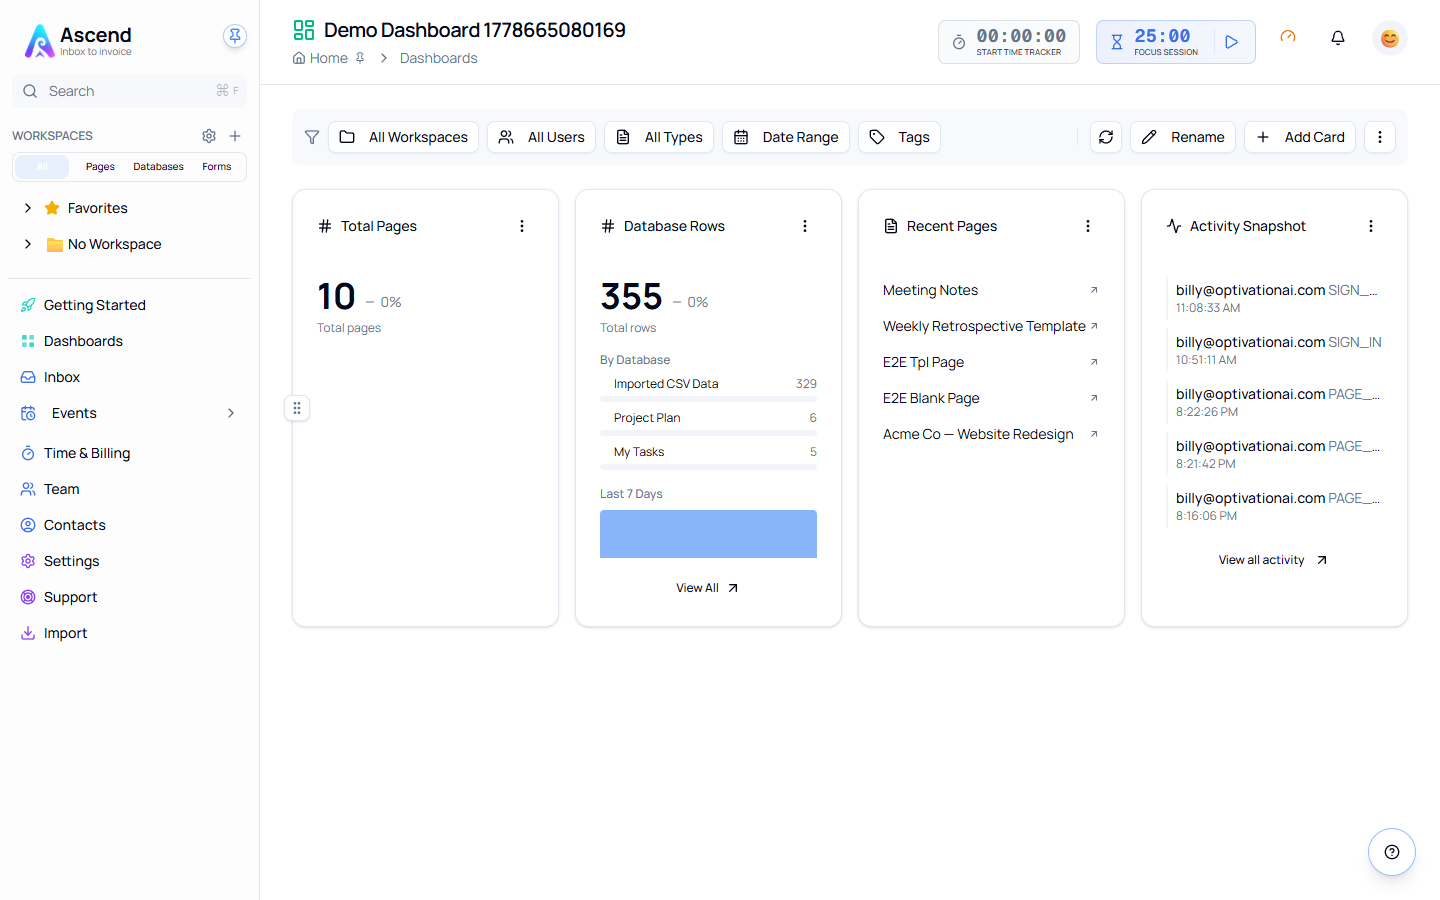
A dashboard is a grid of cards that read live numbers out of your workspace — how many pages exist, which rows are overdue, how much time was logged, what happened in the last week. Dashboards report on data that already exists; they do not hold data of their own.
1Dashboards
Start here
The basics, in the order most people need them.
2Dashboards
Going further
The rest of what this area can do.
Quick start
Your first dashboard
- Go to Dashboards in the sidebar and choose New Dashboard
- Give it a name, leave Include starter cards on
- Open it, then use Add Card to add the numbers you actually want
- Use the filter bar at the top to narrow every card at once
How a dashboard is put together
| Piece | What it does |
|---|---|
| Card | One reading — a count, a breakdown, a list, a rate. Each card has its own settings |
| Filter bar | Workspace, user, entity type, date range and tag filters applied to every card at once |
| Scope | Whether the dashboard belongs to the whole workspace or is bound to one page |
| Visibility | Team (everyone sees it) or Private (only you) |
| Auto-refresh | How often the dashboard re-reads its data while you are looking at it |
What dashboards are not
There is no free-form layout editor. You cannot add text, images or embedded external content to a dashboard, and cards are not resized by dragging their corners. Cards come from a fixed catalogue, are arranged in a grid, and are reordered by dragging.
If you want a page with prose, images and embeds, build a page instead and link to the dashboard from it.
Related
- Databases — the source of most card data
- Time & Billing — where the time and invoice cards get their numbers
- Workspaces — what the workspace filter narrows to